A production possibility frontier (PPF) shows all of the maximum combinations of output of two goods which can be produced given the existing technology and quantity and quality of resources in an economy. Both goods should depend on the same finite resources for their production. PPF diagrams are useful for illustrating the concepts of scarcity and opportunity cost. Note that PPFs are often referred to as production possibility curves.
The PPF curve and potential output
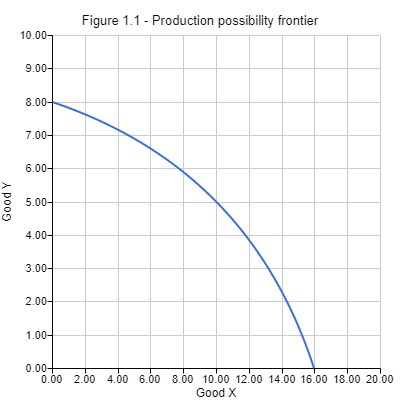
Figure 1.1 shows an economy which can produce a maximum of either 8 Good Y or 16 Good X. Alternatively, the economy could produce any combination of these two types of goods which sit along or inside the PPF curve.
Assuming that technology remains constant, it is not possible for an economy to produce outside of its PPF with existing resources; therefore the periphery of the curve represents a level of production where maximum employment of resources is achieved.
While a PPF can show the maximum amount of output which can be produced, a production point is required to show what is actually being produced or what may be produced in a past, future or hypothetical scenario.
Efficiency and the limits set by the PPF
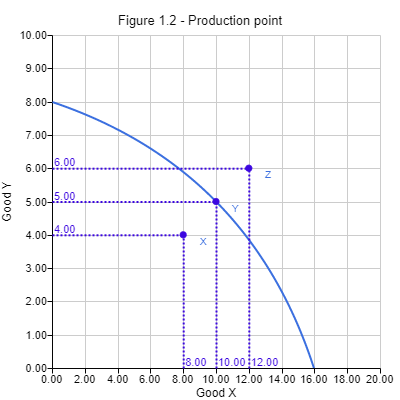
Figure 1.2 shows production points X, Y and Z. At point Y the production point sits on the PPF curve. Maximum employment has been achieved and it is not possible to produce at a higher level of output. This level of output is ‘efficient’ because it indicates that no resources are being wasted.
At point X output is inside the PPF curve. Some resources are being wasted by not being used in the most efficient way. This level of output is ‘inefficient’ because it indicates that not all resources in the economy are fully employed.
At point Z output is outside of the PPF curve. This level of output is ‘unattainable’ because there are not enough resources to produce an output outside the limit set by the PPF.
Movement along the PPF
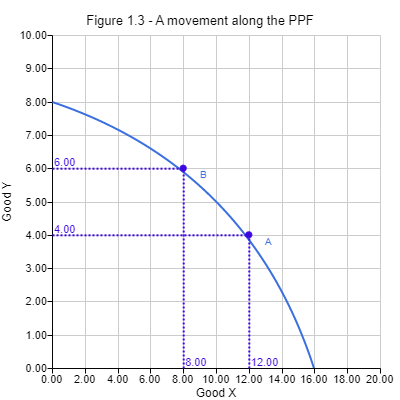
A movement along the PPF represents a reallocation of resources. Figure 1.3 shows a country initially producing at point A. Switching production from point A to point B causes resources to be switched away from producing Good X to producing more of Good Y.
A movement along a PPF curve results in an opportunity cost. By producing an extra 2 Good Y, the country must forgo production of 4 Good X. Therefore, the opportunity cost of moving from point A to point B is 4 Good X.
Shifts in the PPF
An outward shift in the PPF curve is caused by an increase in the quantity or quality of resources or an improvement in technology. For example, new immigration into a country may cause an increase in the labour force. As shown in figure 1.4a, this would result in a growth in production possibilities and an outward shift of the PPF curve.
An inward shift in the PPF curve, as shown in figure 1.4b, is caused by a decrease in the quantity or quality of resources. For example, a flood could result in damages to agricultural land and reduce the amount of fertile ground available for growing crops or raising livestock.

Note that a reverse in the level of technological capabilities could also theoretically cause an inward shift of the PPF curve, but such an event is not often observed in modern times and is therefore rarely a point of focus.
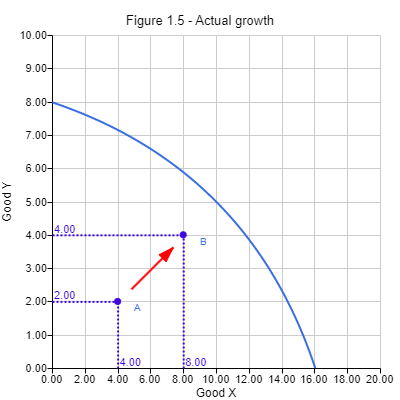
Actual economic growth
As mentioned earlier an outward shift of the PPF curve results in a growth in production possibilities. This means that the country has the potential to produce at a higher level of output. Economists refer to this as ‘potential economic growth’.
In order for the economy to actually produce more goods and services, those extra or better quality resources need to be employed. Figure 1.5 shows a movement of the production point from point A to point B. As the production point moves closer to the PPF curve, employment and efficiency increases. Economists refer to this is as ‘actual economic growth’.
The shape of the PPF
The reason the PPF curve is bow-shaped is due to the law of increasing opportunity costs. Figure 1.3 shows production shifting from the production of Good X to the production of Good Y. At first, resources which are best suited to producing Good Y will be switched over to its production. Relatively few of Good X will need to be forgone, for each additional unit of Good Y.
However, if the production point continues to move along the PPF curve towards the Y axis, eventually resources which are least suited to the production of Good Y will need to be used. An increasing amount of Good X will need to be forgone in order to receive an additional unit of Good Y. Therefore, as a society switches production from one type of good to another, the opportunity cost of producing each additional unit increases.
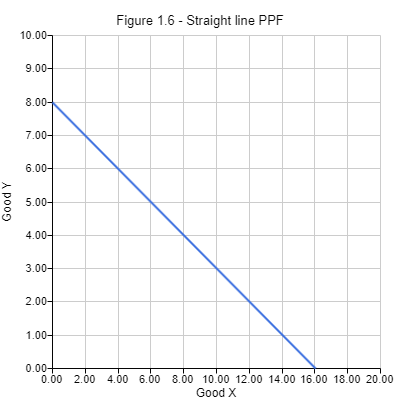
Straight line PPF
In some rare cases, a PPF curve may be shown as a straight line. This suggests that the available resources are perfectly adapted to producing both types of goods. For example, very similar types of raw materials, ingredients and labor would be required to produce both Coca-Cola and Pepsi Cola. In this case, the opportunity cost of switching production from one good to the next remains constant.
Author Profile

- Luke Watson has a BSc (Hons) in International Business and Economics, a PGCE from Warwick University and UK Qualified Teacher Status (QTS). He is currently working as an IBDP Economics teacher at Yew Chung International School of Hong Kong.
Latest entries
- March 10, 2023CourseHow the Fed Sets Interest Rates Post-Crisis
- February 5, 2023CourseHow to Calculate the Gini Coefficient Using the Lorenz Curve
- January 29, 2023CourseHow to Score Full Marks on the Economics IA
- January 29, 2023CourseHow to Effectively Structure Your Economics IA


Comments are closed