The Gini coefficient is a measure of income inequality, used to quantify the degree of inequality in the distribution of income in a population. One common method for calculating the Gini coefficient is using the Lorenz curve.
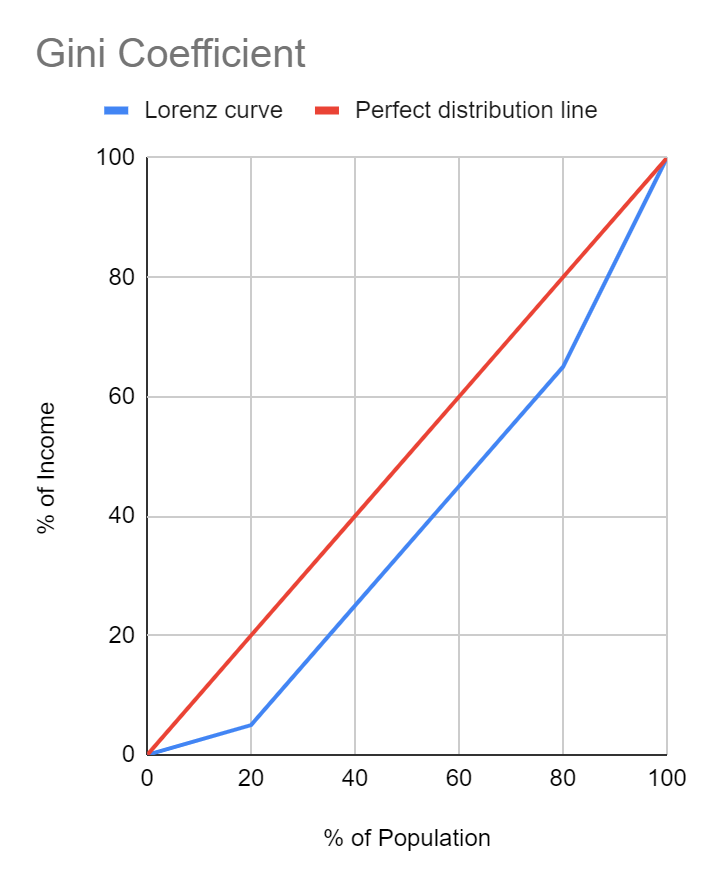
The Lorenz curve is a graphical representation of the cumulative distribution of income in a population, plotting the cumulative proportion of total income held by the bottom x percent of the population on the vertical axis against the cumulative proportion of the population on the horizontal axis.
To calculate the Gini coefficient using the Lorenz curve, we first need to calculate the area between the line of perfect equality (the line of perfect equality is a straight 45-degree angle diagonal line) and the Lorenz curve itself. This area, represented by A, is a measure of income inequality.
Next, we need to calculate the area under the Lorenz curve, which represents the total income received by the population. This area, represented by the letter B, represents the cumulative proportion of total income received by the bottom x% of the population.
Once we have A and B, we can calculate the Gini coefficient as follows:
G = A / (A + B)
Mathematical Example (Rectangular Approximation Method)
Let’s consider a specific example to better understand the calculation of the Gini coefficient using the Lorenz curve.
Table 1 shows the income distribution by quintile.
| % of Population | % of Income |
| 0 | 0 |
| 20 | 5 |
| 40 | 25 |
| 60 | 45 |
| 80 | 65 |
| 100 | 100 |
Note: a quintile represent 20% of the population.
Figure 1.1 is a graphical representation of the Gini coefficient using the data from table 1.
Finding the Area of B
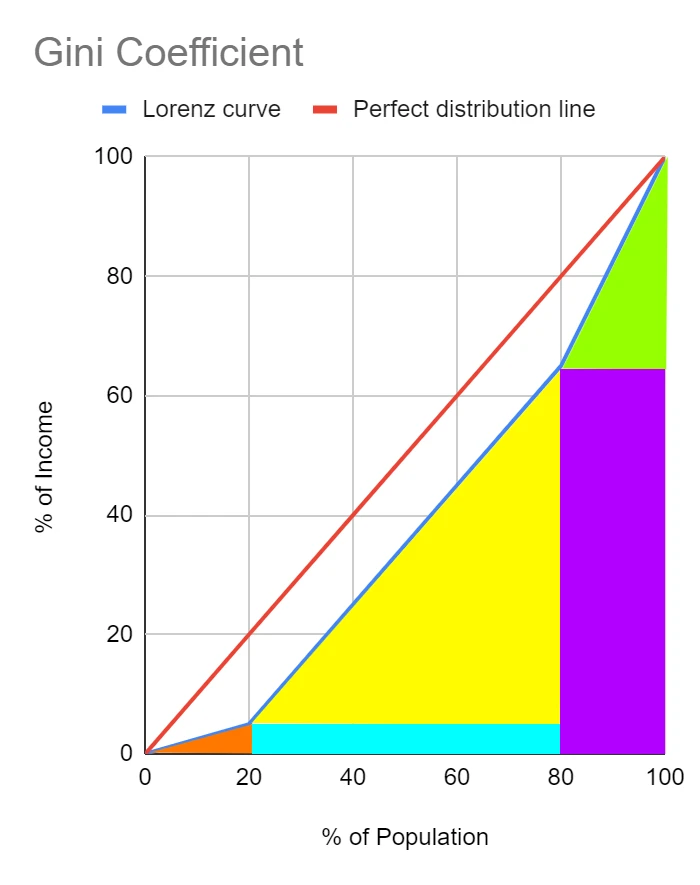
The area under the Lorenz curve can be thought of as a series of triangles and rectangles. Since the area of these shapes can be calculated, determining the area underneath the Lorenz curve becomes a simple, albeit laborious, process.
Figure 1.2 shows the area underneath the Lorenz curve (the area of B) separated into colour coded triangles and rectangles.
The area of a triangle can be calculated using the following formula:
Area of a Triangle = 1/2 * base * height
Where base represents the length of one of the sides of the triangle and height represents the perpendicular distance from the opposite vertex to the base.
Thus:
Area of Triangle 1 = 1/2 * 0.20 * 0.05 = 0.005
Area of Triangle 2 = 1/2 * 0.60 * 0.60 = 0.18
Area of Triangle 3 = 1/2 * 0.20 * 0.35 = 0.035
The area of a rectangle can be calculated using the following formula:
Area of a Rectangle = length * width
Where length represents the length of one of the sides of the rectangle and width represents the length of the other side.
Thus:
Area of Rectangle 1 = 0.05 * 0.60 = 0.03
Area of Rectangle 2 = 0.65 * 0.20 = 0.13
The sum of the areas of the triangles and rectangles is the area under the Lorenz curve (i.e. area B):
Thus:
Area of B = 0.005 + 0.18 + 0.035 + 0.03 + 0.13 = 0.38
Finding the Area of A + B
Since we know that the perfect distribution line is a straight line we can calculate the area of A + B using the area of a triangle formula.
Thus:
Area of A + B = 1/2 * 1 * 1 = 0.5
Note: the area of A + B is a constant set at 0.5. This is because the base and height are defined within the model as each being 1 (i.e. 100%), and the perfect distribution line is always a straight line.
Finding the Area of A
Since we know the area of A + B, and we know the value of B separately we can simply perform the following calculation to find A:
Area of A = A + B – B
Thus:
Area of A = 0.5 – 0.38 = 0.12
Calculating the Gini Coefficient
You may recall from earlier:
G = A / (A + B)
Thus:
G = 0.12 / 0.5 = 2A = 0.24
Author Profile

- Luke Watson has a BSc (Hons) in international business and economics. He is currently working as an IBDP economics teacher at Shanghai United International School in China.
Latest entries
- March 10, 2023CourseHow the Fed Sets Interest Rates Post-Crisis
- February 5, 2023CourseHow to Calculate the Gini Coefficient Using the Lorenz Curve
- January 29, 2023CourseHow to Score Full Marks on the Economics IA
- January 29, 2023CourseHow to Effectively Structure Your Economics IA


Comments are closed