The LRAS is an addition to the AD-AS model, which is used to examine the theoretical perspective of new classical economists. The long-run aggregate supply (LRAS) is a curve which shows the total quantity of goods and services in an economy (real GDP) and the price level during a time period when resource prices are flexible.
Note that before studying LRAS, students should have a good understanding of
short-run aggregate supply (SRAS) and the business cycle.
The long-run and the short-run
The economy is characterized by its production in the short-run and in the long-run. The short-run is a time period when resource prices remain fixed. On the other hand, the long-run is a time period where resources prices are flexible and change in relation to changes in the price level. For example, wages can be adjusted to reflect changes in the cost of living, and prices of non-labour inputs, such as oil, can rise or fall.
The long-run equilibrium
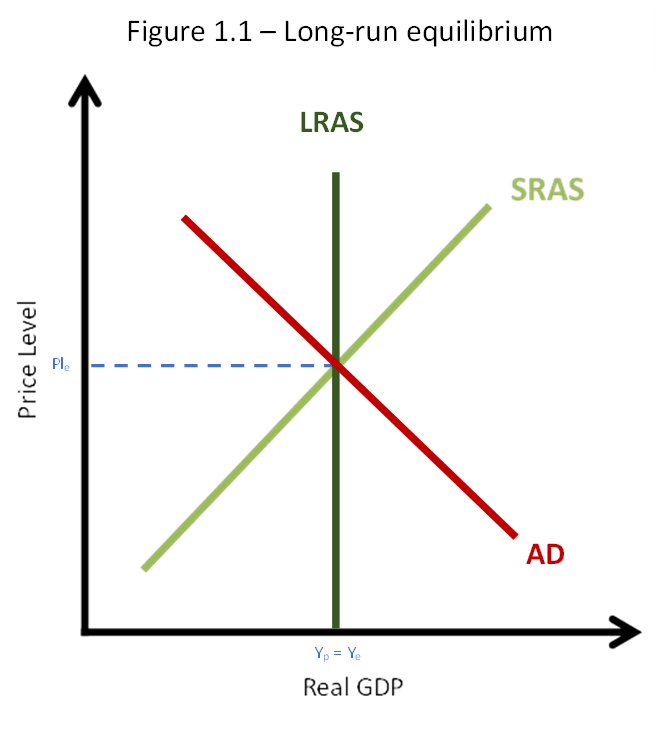
Figure 1.1 shows an economy in a state of long-run equilibrium. The LRAS curve represents the quantity of goods and services produced when the economy is at potential output and full employment.
Due to the flexibility of resource prices in the long-run, firm profitability is unaffected by changes in the price level. This means that in the long-run firms have no reason to increase or decrease their output.
This is illustrated by the vertical slope of the LRAS curve, which indicates that in the long-run changes in aggregate demand (AD) cause changes in the price level but have no effect on real GDP.
Changes in AD
The economy will not always remain in a perpetual state of long-run equilibrium. In the short-run it is possible for shifts in the AD curve to cause an inflationary or deflationary gap. Note that changes in the SRAS curve cannot cause inflationary or deflation gaps, because they are both defined in terms of their relation to actual AD relative to potential output.
Inflationary gap
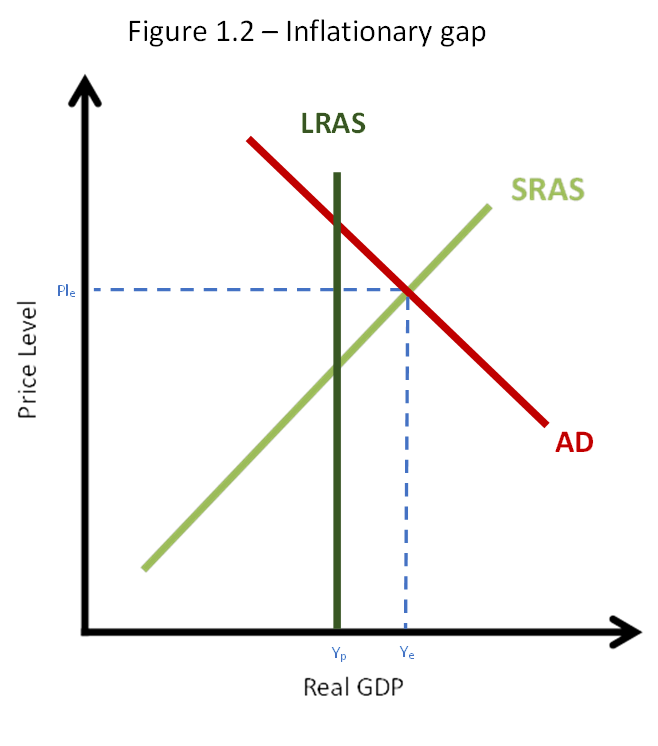
Figure 1.2 shows a scenario where, due to excess demand, the short-run equilibrium is to the right of potential output. Because resource prices remain constant in the short-run, increases in the price level have resulted in higher profits and incentivized firms to increase their production. Economists refer to this as an inflationary gap.
In the long-run, excess demand will put upwards pressure on resource prices such as wages. The increase in resource prices will cause an inward shift of the SRAS curve and an upwards movement along the AD curve. Finally, the economy is returned to the long-run equilibrium.
Deflationary gap
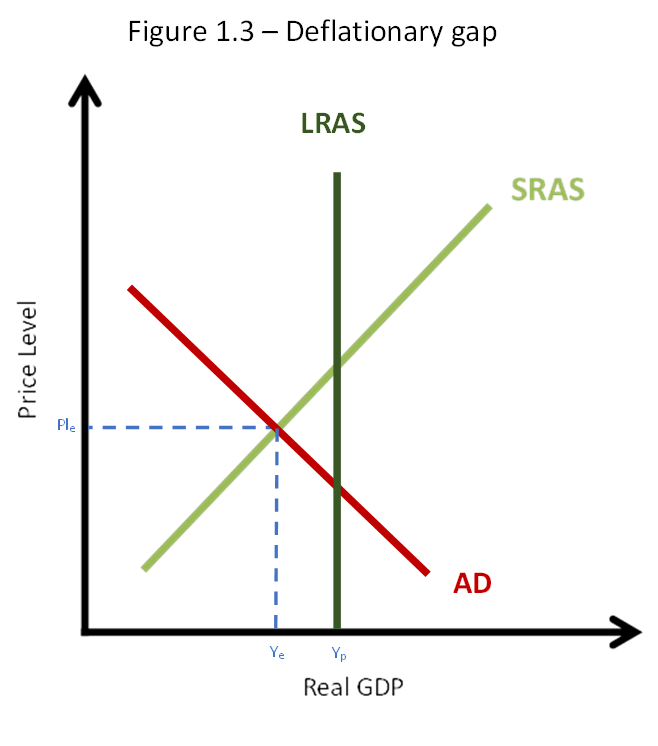
Figure 1.3 shows a scenario where the short-run equilibrium is to the left of potential output. At the current price level, the total demand in the economy is too weak to justify firms producing at the level of potential output. As a result, firms require fewer employees, and unemployment is greater than the natural rate of unemployment. This is known as a deflationary gap.
In the long-run, excess supply will put downwards pressure on resource prices such as wages. The decrease in resource prices will cause an outward shift of the SRAS curve and a downwards movement along the AD curve. Finally, the economy is returned to the long-run equilibrium.
LRAS and its relationship to the business cycle
Inflationary and deflationary gaps in the new classical model roughly correspond to the four phases of the business cycle:
- Expansion and peak – During the time period of expansion to peak in the business cycle, actual output exceeds potential output. In the new classical model this corresponds to an inflationary gap caused by actual AD being greater than potential output
- Contraction and trough – During the time period of contraction to trough in the business cycle, actual output falls below potential output. In the new classical model this corresponds to a deflationary gap caused by potential output being greater than actual AD
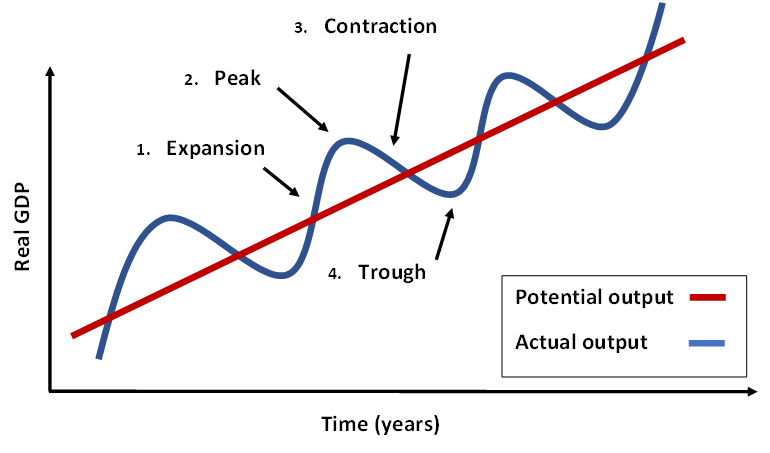
The purpose of the business cycle is to show the ebb and flow of economic activity over time. Therefore, the business cycle model is not useful for illustrating the long-run equilibrium.
Changes in SRAS
Changes in the SRAS curve can also be responsible for fluctuations in the business cycle. As shown in figure 1.4, a shift of the SRAS curve from SRAS0 to SRAS1 leads to a contraction in real GDP and an increase in the general price level.
This scenario, which is known as ‘stagflation’, presents considerable challenges for an economy. Policy makers will need to concern themselves with combatting the negative effects of an increase in unemployment along with a simultaneous increase in the rate of inflation.
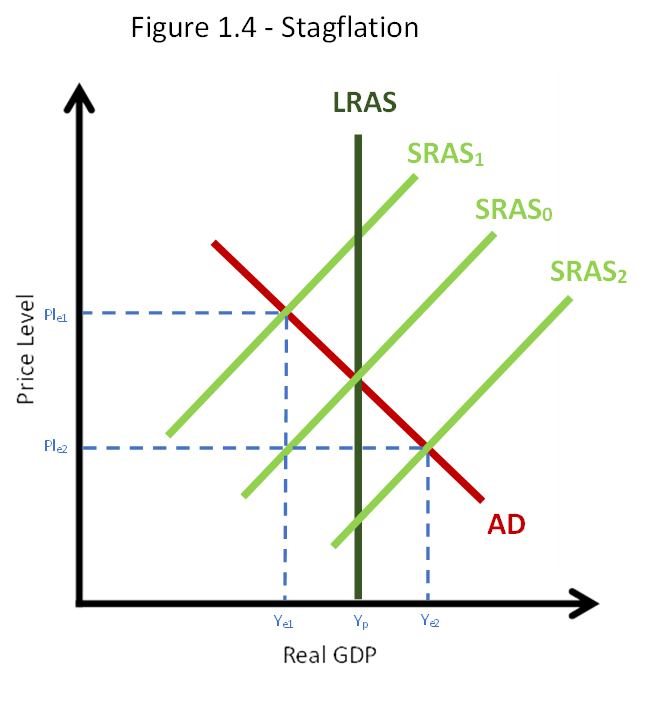
In the long-run, there will be a fall in the price level accompanied by a fall in the price of resource inputs. This will cause an outward shift of the SRAS curve from SRAS1 to SRAS0 and a downwards movement along the AD curve. Finally, the economy is returned to the long-run equilibrium.
A shift of the SRAS curve from SRAS0 to SRAS2 leads to an expansion in real GDP and a decrease in the general price level. In the long-run, there will be a rise in the price level accompanied by a rise in the price of resource inputs. This will cause an inward shift of the SRAS curve from SRAS2 to SRAS0 and an upwards movement along the AD curve. Finally, the economy is returned to the long-term equilibrium.
Changes in LRAS
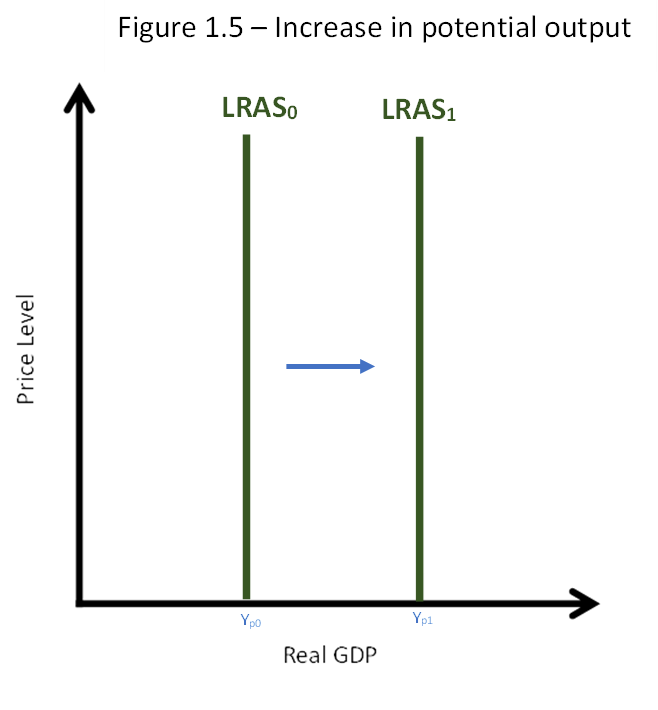
Changes in LRAS are caused by changes in the quantity or quality of resources. As shown in figure 1.5, a shift of the LRAS curve from LRAS0 to LRAS1 will result in an increase in potential output.
Over the long-run, the economy will learn to make use of these extra or better quality resources and there will be an outward shift of the SRAS curve. This will result in an increase in actual output and a decrease in the price level.
Changes in the quantity of resources
Increases in the quantity of the factors of production increase the potential output of the economy. For example, the discovery of large deposits of gold will enable the economy to produce at a higher level of real GDP. This is illustrated by an outward shift of the LRAS curve. Conversely, decreases in the quantity of the factors of production will cause an inward shift of the LRAS curve.
Changes in the quality of resources
Increases in the quality of the factors of production increase the potential output of the economy. For example, improvements to the nation’s education system will over time lead to a more highly skilled labour force and increase the economy’s productive potential. This is illustrated by an outward shift of the LRAS curve. Conversely, a decrease in the quality of the factors of production will cause an inward shift of the LRAS curve.
Changes in technology
Improvements in technology may result in increases in the quality of capital goods and improve productive efficiency. For example, the invention of the sewing machine brought about significant gains in efficiency compared to hand sewing and lead to the industrialization of the clothing and textile industry. This is illustrated by an outward shift of the LRAS curve. Theoretically, a deterioration in the level of technology could result in an inward shift of the LRAS curve.
Institutional change
Institutions help to develop and sustain the shared values, preferences and individual habits of society, and they are involved in the creation and enforcement of laws, regulations and bureaucratic processes. Thus, improvements to institutions or the adoption of new and better institutions, will allow a country to make better use of its scarce resources. This is illustrated by an outward shift in the LRAS curve. A deterioration in the quality of institutions would cause an inward shift of the LRAS curve.
Changes in the natural rate of unemployment
Over time it is possible for the natural rate of unemployment to change. For example, from 2016 to 2017 a large number of manufacturing jobs were brought back to the USA (reshoring). This provided many new jobs for blue collar workers, and thereby reduced structural unemployment in the USA. A decrease in the natural rate of unemployment will result in an increase in an economy’s productive potential. This is illustrated by an outward shift of the LRAS curve. Conversely, an increase in the natural rate of unemployment would be illustrated by an inward shift of the LRAS curve.
Author Profile

- Luke Watson has a BSc (Hons) in international business and economics. He is currently working as an IBDP economics teacher at Shanghai United International School in China.
Latest entries
- March 10, 2023CourseHow the Fed Sets Interest Rates Post-Crisis
- February 5, 2023CourseHow to Calculate the Gini Coefficient Using the Lorenz Curve
- January 29, 2023CourseHow to Score Full Marks on the Economics IA
- January 29, 2023CourseHow to Effectively Structure Your Economics IA


Comments are closed