Demand refers to the willingness and ability to purchase a specific good or service across different prices. Willingness is the desire to buy a good, while ability is having the funds to afford it. Within the branch of microeconomics, demand is separated into individual demand and market demand. Individual demand is the quantity of a product a single consumer is willing and able to buy across different prices. Market demand is the total demand of a product across different prices.
Individual demand
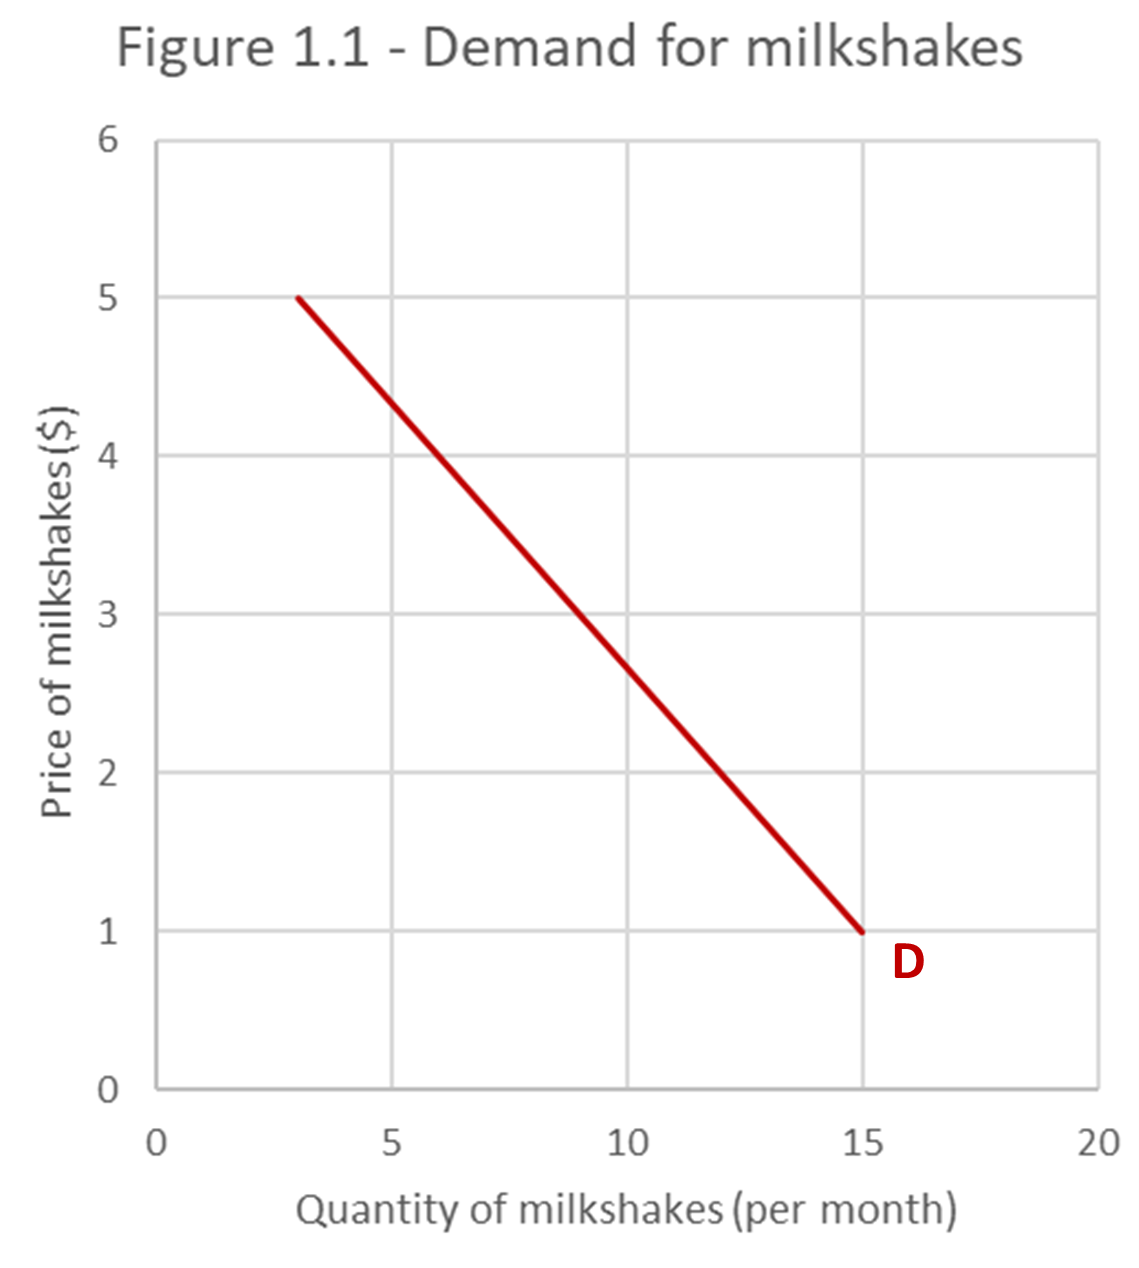
A demand schedule is a table which lists the quantities demanded over a range of prices. Table 1.1 shows a consumer’s demand schedule for milkshakes.
When the price of milkshake is $5, the consumer will demand 3 milkshakes in a month. When the price of a milkshake is $1, the consumer will demand 15 milkshakes in a month. Note that the demand schedule cannot identify how many milkshakes the consumer will buy. This is determined by the interaction between demand and supply.
| Price of milkshake ($) | Quantity of milkshakes demanded (per month) |
| 5 | 3 |
| 4 | 6 |
| 3 | 9 |
| 2 | 12 |
| 1 | 15 |
The law of demand
The information listed in the demand schedule can be illustrated using a demand curve as shown in figure 1.1. The downward slope of the demand curve shows that, ceteris paribus, there is a negative causal relationship between price and the quantity demanded. This relationship is so empirically consistent that it is commonly known as the law of demand.
For the sake of simplicity, economists often draw demand ‘curves’ using straight lines. Using real-world data, it is much more likely that the relationship between price and the quantity demanded would be non-linear. As such, the demand curve would bow-inwards and represent a curve.
Market demand
So far we have discussed the individual demand of a product for a single consumer. Economists derive the market demand by adding together all of the individual demands for a particular product. Because the market demand is the summation of all individual demands, ceteris paribus, the law of demand remains in effect at both the level of the individual and the market. The focus of our study will now shift from individual demand to market demand.
Movements along the demand curve
Any change in price will result in a movement along the demand curve. A decrease in price causes an increase in the quantity demanded, resulting in a downwards movement along the demand curve. An increase in price causes a decrease in the quantity demanded, resulting in an upwards movement along the demand curve.
To avoid confusion between ‘a change in demand’ and ‘a change in the quantity demanded’, some economists refer instead to an extension and contraction in demand. An extension in demand is an increase in the quantity demanded. Conversely, a contraction in demand is a decrease in the quantity demanded. For our purposes, extension and contraction of demand will be the preferred terminology.
Shifts in market demand
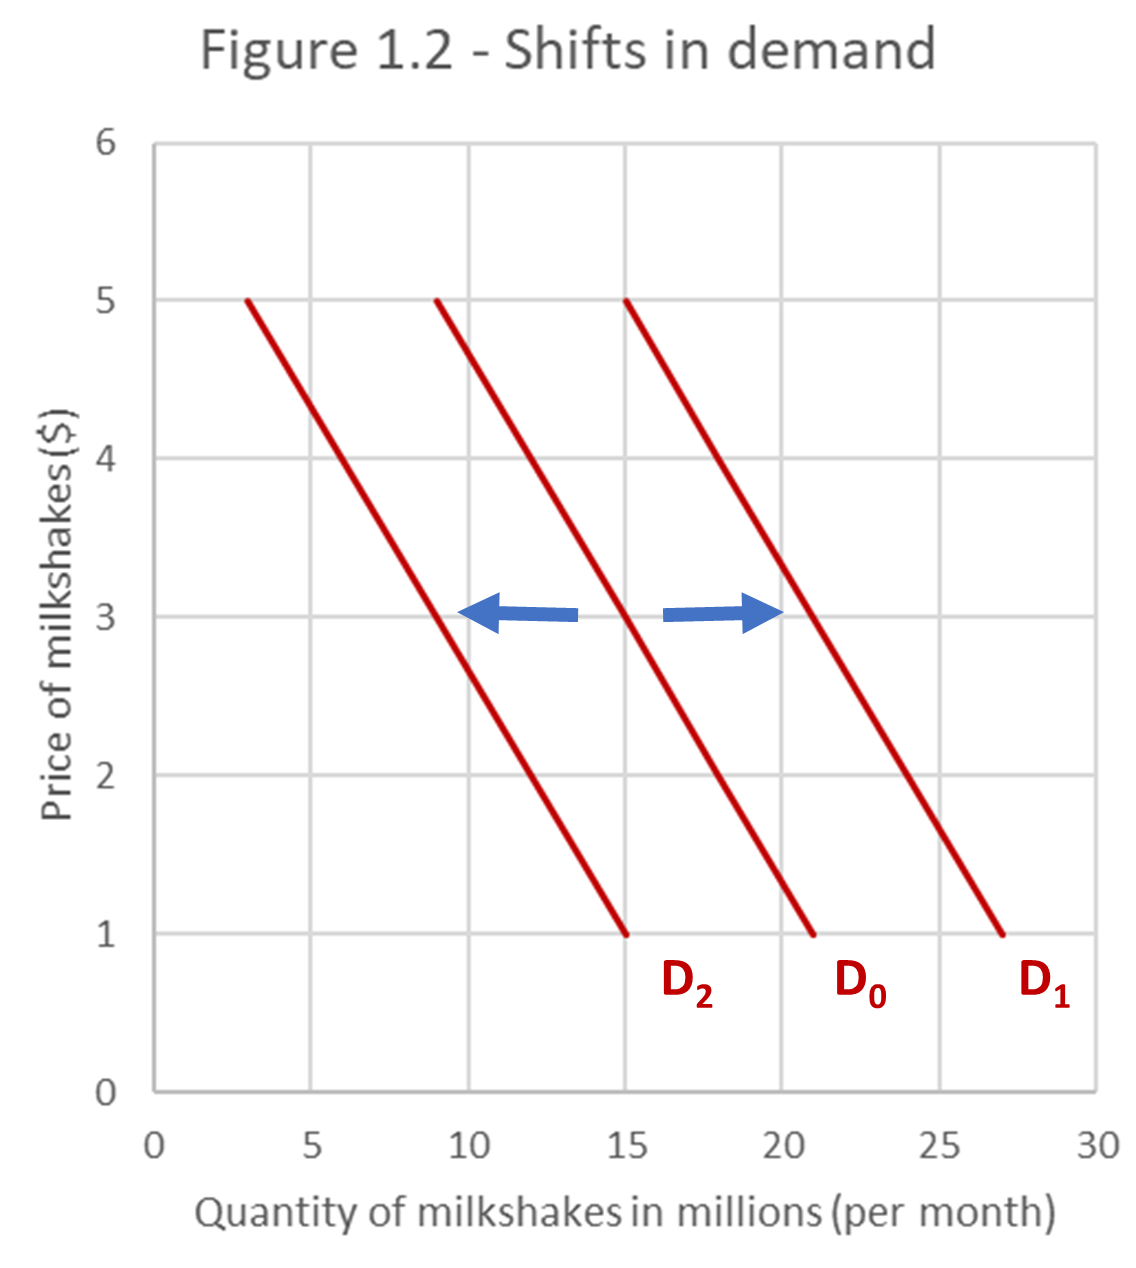
Non-price determinants are the variables, such as income, which are assumed to hold constant under normal conditions. As shown in figure 1.2, a change in non-price determinants causes a shift in the demand curve.
A change in income (normal goods)
A normal good experiences an increase in demand as a result of an increase in consumer income. Therefore, for a normal good an increase in consumer income will cause an outward shift of the demand curve from D0 to D1. Conversely, a decrease in consumer income will cause an inward shift of the demand curve from D0 to D2.
A change in income (inferior goods)
An inferior good experiences a decrease in demand as a result of an increase in consumer income. This occurs because consumers make rational purchasing decisions based on their preferences and budgetary constraints. As incomes rise, more and better quality goods become affordable to the average consumer. In this situation, consumers will tend to buy more normal goods and fewer inferior good in order to pursue a better lifestyle.
For an inferior good, an increase in consumer income will cause an inward shift of the demand curve and a decrease in income will cause an outward shift of the demand curve. Examples of inferior goods include second-hand clothing, instant noodles, and public transportation.
A change in the price of substitute goods
A substitute good is a product which can be used in the place of another, because it satisfies a similar want or need. Substitutes are considered beneficial to a market, because their presence increases competition and provides consumers with a greater range of choices. This often leads to lower prices and better satisfaction for consumers.
A change in the price of a good causes a shift in the demand curves of its substitutes. For example, consumers that are in the market to buy soda can choose between either Coca-Cola or Pepsi. If the price of Coca-Cola were to rise, more consumers would switch to buying Pepsi. This would cause an outward shift of Pepsi’s demand curve. On the other hand, if the price of Coca-Cola were to fall, more consumers would switch to buying Coca-Cola. This would cause an inward shift of Pepsi’s demand curve.
A change in the price of complementary goods
A complementary good is a product which adds value to another good. For example, for many consumers the combination of tea with sugar provides greater utility than tea consumed on its own. A decrease in the price of tea would cause an extension in the demand for tea, and an outward shift of the demand curve for sugar. An increase in the price of tea would cause a contraction in the demand for tea, and an inwards shift of the demand curve for sugar.
A change in consumer preferences and tastes
Consumers tastes and preferences can sometimes change. For example, consumers in the 1970’s had different fashion tastes compared to consumers in the early 2000’s. If tastes change in favour of a product, this will cause an outward shift of the demand curve. If tastes change against a product, this will cause an inward shift of the demand curve.
A change in the number of consumers
If there is an increase in the number of consumers within a market, this will cause an outward shift in the demand. On the other hand, if there is a decrease in the number of consumers within a market, this will cause an inward shift in the demand curve. This follows logically from the fact that market demand is derived by adding together all of the individual demands for a particular product.
The law of diminishing marginal utility
Now that you have read this article, you may wish to extend your knowledge by reading about about the law of diminishing marginal utility. An understanding of marginal utility can give greater insight into the law of demand.
Author Profile

- Luke Watson has a BSc (Hons) in international business and economics. He is currently working as an IBDP economics teacher at Shanghai United International School in China.
Latest entries
- March 10, 2023CourseHow the Fed Sets Interest Rates Post-Crisis
- February 5, 2023CourseHow to Calculate the Gini Coefficient Using the Lorenz Curve
- January 29, 2023CourseHow to Score Full Marks on the Economics IA
- January 29, 2023CourseHow to Effectively Structure Your Economics IA


Comments are closed