Aggregate demand (AD) is the total demand for all finished goods and services in an economy (national output) across different price levels, ceteris paribus. The output of the AD curve is the linear summation of four distinct components of spending across different values of the price level:
- Consumer spending (C) – personal consumption on consumer durables, consumer non-durables and services
- Investment (I) – spending on physical capital, new constructions and inventories
- Government spending (G) – public investments made by the government usually involving infrastructure such as roads or airports, and purchases by the government of factors of production
- Net exports (NX) – the total value of all domestically produced products sold abroad (exports) minus the total value of all foreign produced products purchased domestically (imports)
Thus, AD = C + I + G + NX
The above formula is identical to the ‘expenditure approach’ of calculating GDP via national expenditure. However, the circular flow of income model shows that in equilibrium the value of national expenditure is equal to national output and national income. Thus, the expenditure approach can be used to calculate both AD and GDP, and is the accepted approach in most curricula due to its relative simplicity.
Considering that the formula for AD and GDP are identical, inquisitive students may question how AD and GDP differ from one another. While GDP is expressed as a singular value, AD is plotted as a curve showing how real GDP relates to different price levels. Thus, AD is equal to GDP only at the point of equilibrium.
Movements along the AD curve
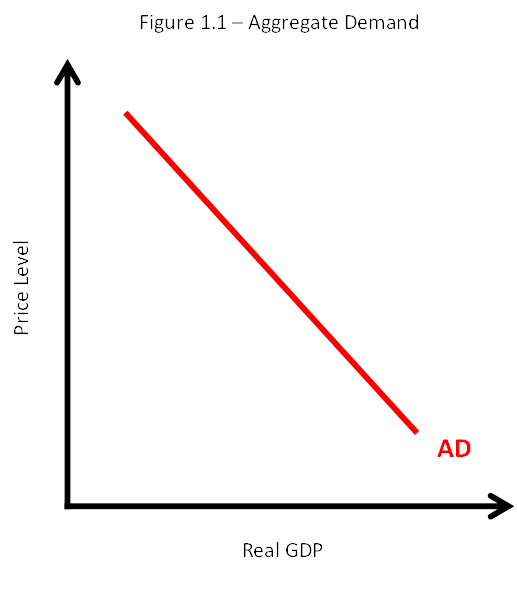
Figure 1.1 shows a downwards sloping AD curve. The downward slope of the curve indicates that there is a negative relationship between the price level and the aggregate output demanded. This is because of the income effect. At lower price levels, consumers will have higher disposable incomes which will result in higher levels of consumption.
The price level and national income (Real GDP) as well as their relationship to each other are measured on the Y and X axes respectively. Thus, changes to either variable cannot cause a shift in the AD curve, but instead cause a movement along the AD curve. For example, an increase in the price level would cause a movement up along the AD curve.
Shifts in the AD curve
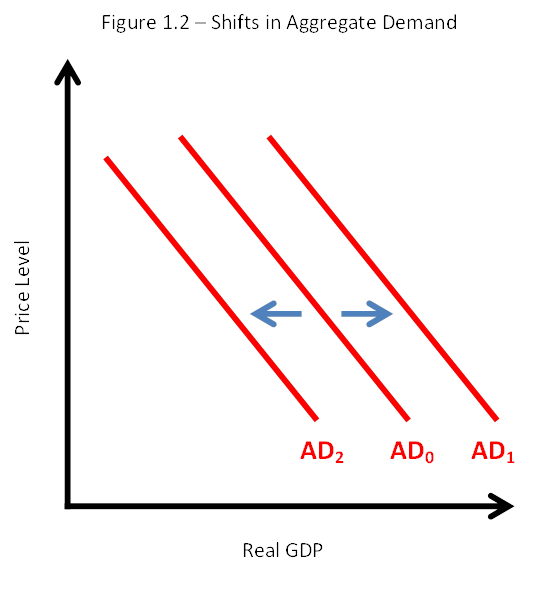
As shown in figure 1.2, any changes to one or more of the four components of spending (C, I, G, and NX) causes a shift in the AD curve.
Changes in consumption (C)
Consumer confidence is a measure of how optimistic consumers are about their future income and the future of the economy. An increase in consumer confidence causes an increase in consumer expenditure. The result is an outward shift of the AD curve from AD0 to AD1. A decrease in consumer confidence would cause an inward shift of the AD curve from AD0 to AD2.
The cost of borrowing rises and falls corresponding with changes to interest rates. Since some consumer expenditure is funded via borrowing, there is an inverse relationship with the cost of borrowing and the level of consumer expenditure. Thus, an increase in interest rates will cause an inward shift of the AD curve, and a decrease will cause an outward shift of the AD curve.
According to the wealth effect theory, consumer confidence and consumer expenditure increase when the value of assets such as homes or shares in the stock market rise. Therefore, an increase in wealth will cause an outward shift of the AD curve, and a decrease will cause an inward shift of the AD curve.
Increases in income taxes result in lower levels of disposable income, which means households have less money available for discretionary spending on goods and services. Thus, an increase in income taxes reduces consumer expenditure and causes an inward shift of the AD curve, and a decrease in income taxes increases consumer expenditure and causes an outward shift in the AD curve.
When consumers have high levels of household debt, they will be under pressure to make payments on their loans plus interest. Many consumers will need to cut back on their spending in order to cover their expenses. Thus, an increase in the level of household indebtedness causes an inward shift of the AD curve, and a decrease causes in an outward shift of the AD curve.
If consumers anticipate an inflationary period in the future, they may increase their purchases now to take advantage of lower prices in the present. This causes an outward shift of the AD curve. Conversely, if consumers anticipate a deflationary period in the future, they may hold back their purchases now to take advantage of lower prices in the future. This causes an inward shift of the AD curve. Note that a shift in the AD curve is caused by changes in expectations of future price levels, not changes in the price level itself.
Changes in investment (I)
When business confidence is high firms will be more willing to take on risks and spend more on investment. This causes an outward shift in the AD curve. High levels of business pessimism will have the opposite effect, resulting in firms engaging in less risk-taking activities and spending less on investment. This causes an inward shift of the AD curve.
As mentioned previously, the cost of borrowing rises and falls corresponding with changes to interest rates. An increase in interest rates will make it more expensive to finance investment through borrowing. This results in an inward shift of the AD curve. A decrease in interest rates will encourage firms to borrow more to invest in growing their business. This results in an outward shift of the AD curve.
New technological developments present firms with the opportunity to increase productive efficiency or improve the quality of their products. This incentivizes firms to invest in new technologies. Those firms which fail to invest in new technology may struggle to remain relevant, particularly in competitive industries. Thus, improvements to technology cause an outward shift in the AD curve.
Firms typically pay a percentage of their profits to the government in the form of corporation tax. The greater the level of taxation on firms, the less financial capital available for investment. An increase in taxes on the profits of firms causes an inward shift of the AD curve. A decrease in taxes on the profits of firms causes an outward shift in the AD curve.
The level of corporate indebtedness refers to the level of debt which firms have accrued due to past borrowing. When firms are highly indebted they will be less willing to invest. Thus, an increase in corporate indebtedness causes an inward shift of the AD curve and a decrease causes an outward shift in the AD curve.
Many developing economies suffer from problems with corruption and a lack of faith in the rule of law. Changes to a nation’s legal systems and institutional quality can help move a country towards a more stable business environment and help firms to grow and gain access to financing. For example, following reforms in Western Germany, such as the returning of property rights in 1948, the region experienced a long period of high economic growth. This causes an outward shift in the AD curve.
Changes in government spending (G)
Changes in political priorities can cause governments to shift focus which often results in increases or decreases in public spending. An increase in public spending causes an outward shift of the AD curve and a decrease causes an inward shift in the AD curve.
In some cases the government may take deliberate actions to increase AD in order to avoid recession or soften the impact of a contractionary period in the economy. This will typically involve an increase in public spending resulting in an outward shift of the AD curve.
Changes in net exports (NX)
Changes in the national income of foreign countries will impact foreign demand for domestically produced products. An increase in the national income of foreign countries causes an increase in exports and an outward shift of the AD curve. Conversely, a decrease in the national income of foreign countries causes a decrease in exports and an inward shift of the AD curve.
The exchange rate is the ratio for converting one currency into another. Changes in the exchange rate affect domestic demand for imports and foreign demand for exports. An appreciation in the domestic currency causes a decrease in exports and an increase in imports. A depreciation in the domestic currency causes an increase in exports and a decrease in imports. The former causes an outward shift in the AD curve and the latter causes an inward shift in the AD curve.
Trade protection refers to government policy design to restrict free trade. It includes, but is not limited to, import tariffs, subsidies and quotas. If a government imposes new trade restrictions this will result in a reduction in imports. Conversely, if the government lifts trade restrictions this will result in an increase in imports. The former causes an outward shift in the AD curve, and the latter causes an inward shift in the AD curve. However, imposing protectionist policies risks a retaliatory response, potentially resulting in significant economic harm to all parties involved.
Summary of the causes of shifts in AD
Changes in consumer spending, arising from:
- Changes in consumer confidence
- Changes in interest rates (monetary policy)
- Changes in wealth
- Changes in personal income taxes (fiscal policy)
- Changes in the level of household indebtedness
- Expectations of future price levels
Changes in investment spending, arising from:
- Changes in business confidence
- Changes in interest rates (monetary policy)
- Changes (improvement) in technology
- Changes in business taxes (fiscal policy)
- Changes in the level of corporate indebtedness
- Legal/institutional changes
Changes in government spending, arising from:
- Changes in political priorities
- Changes in economic priorities
Changes in foreigners’ spending, arising from:
- Changes in national income abroad
- Changes in exchange rates
- Changes in the level of trade protection
Author Profile

- Luke Watson has a BSc (Hons) in international business and economics. He is currently working as an IBDP economics teacher at Shanghai United International School in China.
Latest entries
- March 10, 2023CourseHow the Fed Sets Interest Rates Post-Crisis
- February 5, 2023CourseHow to Calculate the Gini Coefficient Using the Lorenz Curve
- January 29, 2023CourseHow to Score Full Marks on the Economics IA
- January 29, 2023CourseHow to Effectively Structure Your Economics IA


Comments are closed